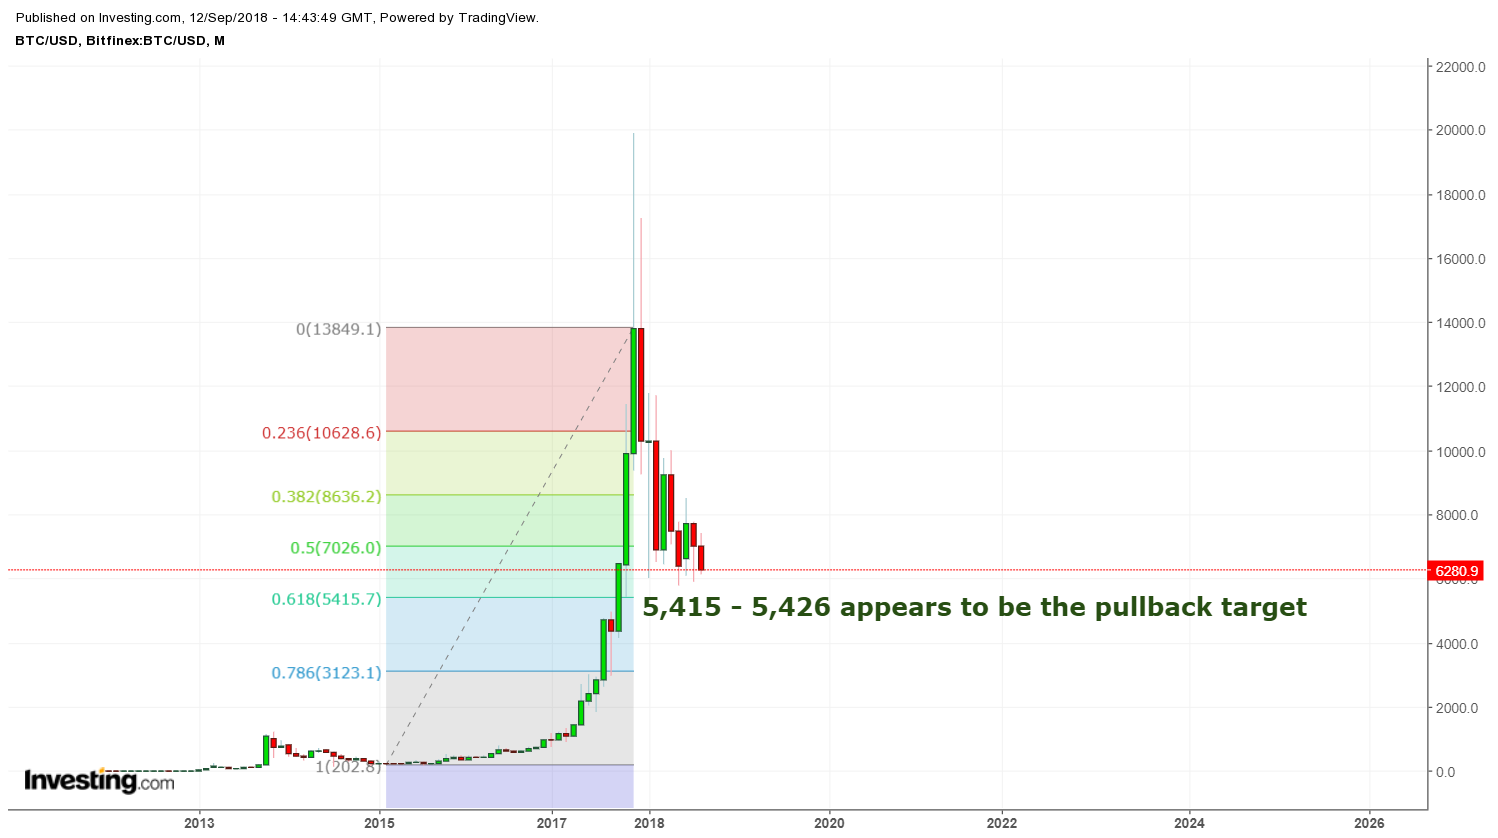
#Bitcoin #Crypto I'm no specialist in Bitcoin or cryptocurrencies - but charts are charts and technical analysis holds pretty true as long as the security or instrument being analyzed is traded with good volume and has the attention of the masses. Psychology and math have to be at work or technical analysis is not as effective. I think it's safe to say at this point that crypto and Bitcoin in particular have the attention of the masses, trade with volume and can be analyzed with math.
The chart of Bitcoin / USD below shows BTC on a monthly basis going back to 2016. By the looks of it, BTC has short-term support at 6,059 based on Elliott Wave / Fibonacci analysis and then has another layer of possible support at the horizontal line created by the recent lows at 5,762. Below that, we're going to the very long-term Fibonacci pullback targets (using monthly closing levels for the endpoints of the overall range) at 5,415 - 5,426.
People love this stuff, so buys can certainly be attempted and could provide nice short-term rewards if support holds at any of the ST levels. However, a drop from 6,059 to 5,415 can also happen in a hurry. So either be comfortable with the volatility going into the long position or honor stops just below 6000, 5700 and 5400, respectively. If crypto is for real and not going to fade away into the wind, then buying BTC or proxies near support and holding long-term could be a massive homerun.
Recent free content from Peak Analytics & Consulting
-
 S&P futures may see short-term bounce ahead of test of 4,005
— 8/26/22
-
 NASDAQ futures update...
— 3/08/22
-
 AAPL historical pattern could lead market lower
— 8/03/20
-
 UPDATED S&P FUTURES LEVELS BASED ON TODAY'S ACTION...
— 12/20/18
-
 Headed to 2412 - 2417
— 12/20/18
-
{[comment.author.username]} {[comment.author.username]} — Marketfy Staff — Maven — Member


