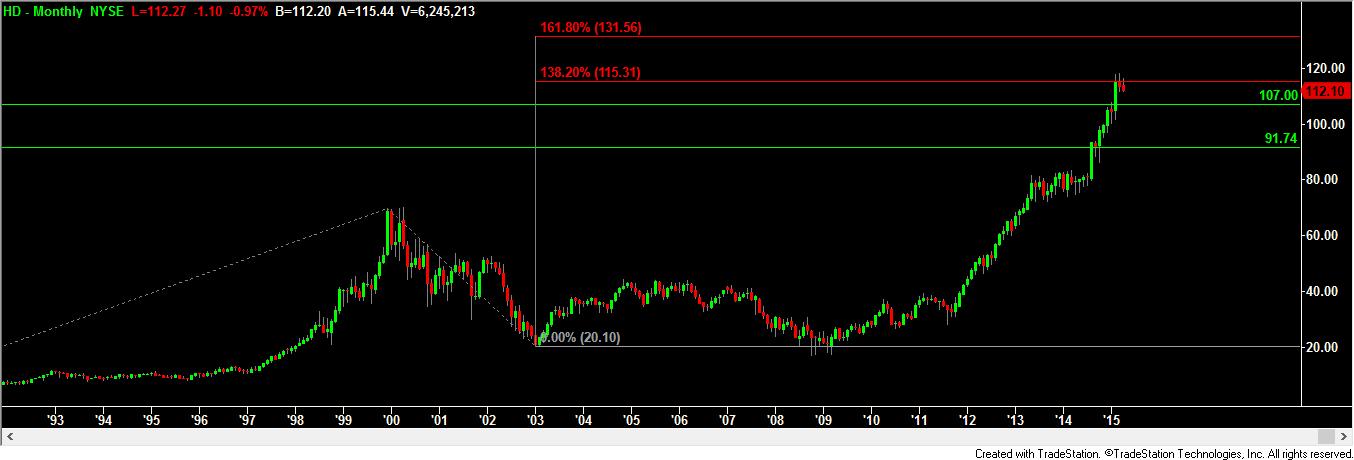
Home Depot may have just completed a very long-term “third wave thrust” to the upside when it peaked out at $117.99 in March. Going back to the inception of HD’s trading back in December of 1991, the $115.31 level represented at 138.2% Fibonacci price projection line for this third wave on a monthly chart. The fact that HD traded above that level intra-month and then closed back below that level (for the second month in a row, by the way), lends credibility to the idea of this being a short-term peak for the stock. There are two possible pullback scenarios from here: first, a pullback to around $107 which would then be followed by a move up to the next Fibonacci projection at $131.56; or, a deeper correction down to $91 which would only be followed by a retest of the $115.31 resistance. Much of that may depend on whether the S&P holds support at 2030 (on the futures). Watch the action carefully at around $107.
Recent free content from Peak Analytics & Consulting
-
 S&P futures may see short-term bounce ahead of test of 4,005
— 8/26/22
-
 NASDAQ futures update...
— 3/08/22
-
 AAPL historical pattern could lead market lower
— 8/03/20
-
 UPDATED S&P FUTURES LEVELS BASED ON TODAY'S ACTION...
— 12/20/18
-
 Headed to 2412 - 2417
— 12/20/18
-
{[comment.author.username]} {[comment.author.username]} — Marketfy Staff — Maven — Member


