Good afternoon!
Every now and then, I force myself to try to look at things with "the other side's" bullish lenses on - just to be sure I'm not missing anything obvious.
Today, I looked at the monthly charts of ES, NQ and IWM (Russell 2000 ETF).
While the ES and NQ charts are challenging to decipher, the IWM chart provided me with some clarity on the possible true wave count for the market.
Take a look:
This chart clearly indicates that the small caps just completed an abc downside correction for wave iv of 3. The next (current) wave is now wave v of 3 to the upside with a projected target of 126.14 to 137.18 (from 100.45 currently). Once that peak is made up there, another sharp decline should commence for wave 4 lower.
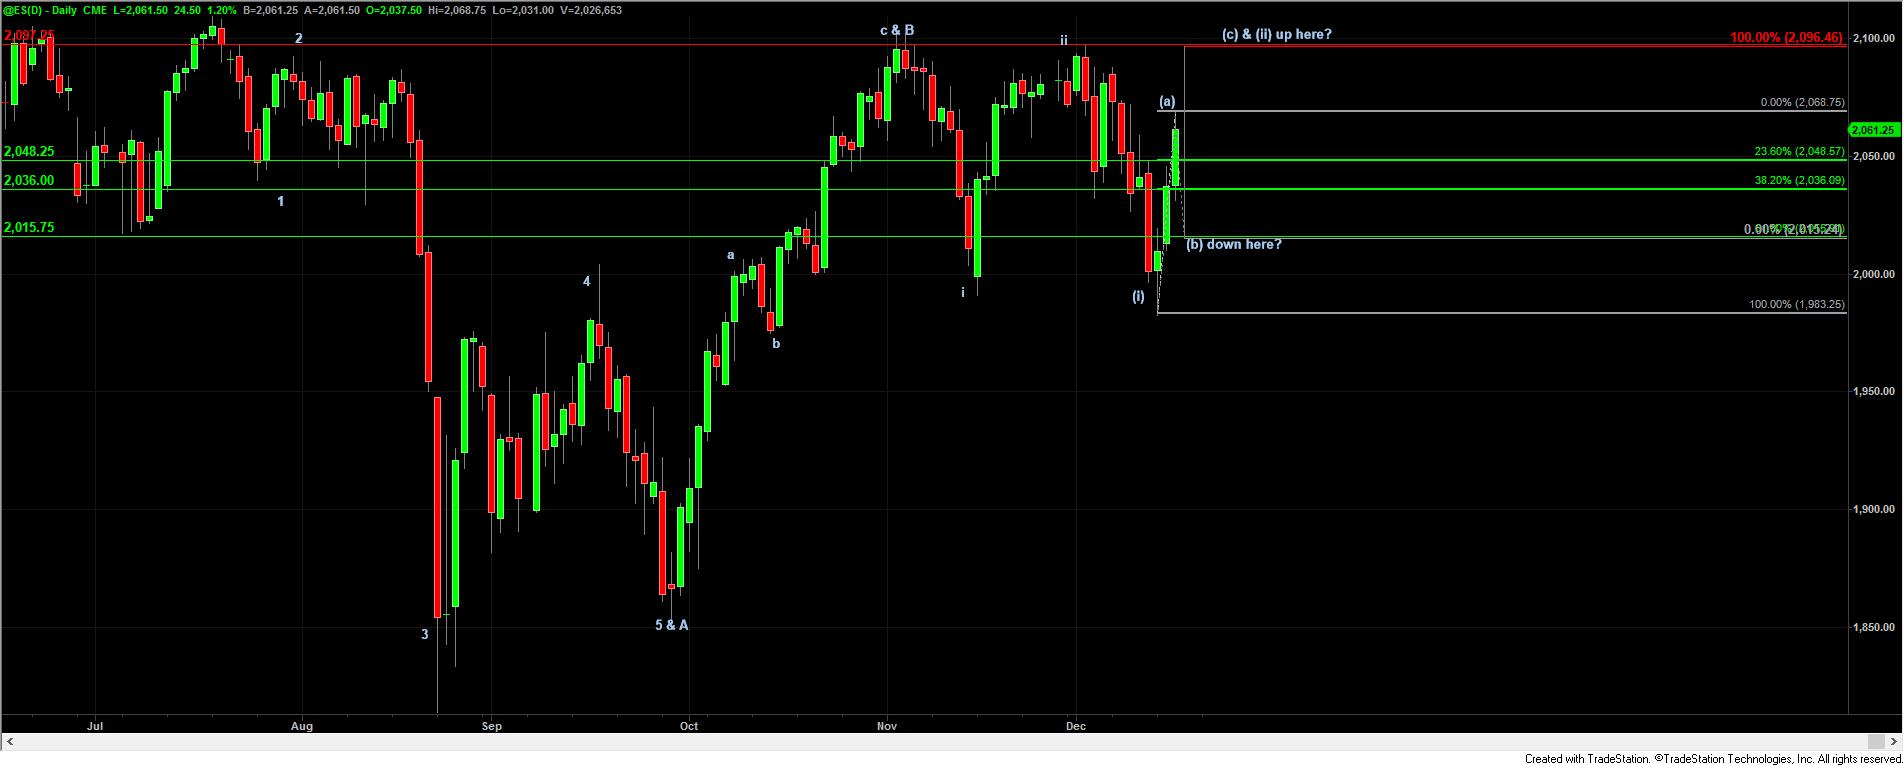
I did the same exercise for the ES and NQ charts and came up with the findings on the attached SS.
All this being noted, and with the knowledge that crude may have room up to 34 or so in the short-term (after a brief pullback hopefully), it may be the proper move to look to buy dips until the wave v peaks are made. Short / bearish may be wrong for a while.
My calls for much lower prices for ES may have been off in timing / wave count, but they remain pretty much intact for after the current wave "v" peak is made. Sorry for the sudden adjustment, but I owe it to you to present this stuff when I discover it.


